Is America a Gerontocracy?
A chart crime sends me down a rabbit hole

tl;dr My best guess on the US is that nothing strange is really going on with the age of it’s legislators. They have been ageing roughly inline with the population - society is just getting older.
There is a chart which did the rounds a few days ago. eg Liberty's post from last week:


This looks to me like the age of Congress has gone absolutely parabolic in the last couple of years… but is this true? I hate the gerontocracy as much as the next guy, so I was inclined to believe it, but it did look a bit too convenient to me. After all, when you look at the tail of a distribution, if you shift the mean a bit, then the number above a threshold can move very quickly.
Plotting the median age of Congress (and various percentiles) Congress has actually been ageing fairly gradually.

It looks to me like congress has been ageing in-line with the median age in the US. (Aside - if anyone knows how to get historic demographic data from the US census going back prior to 1950 - let me know - or similar data for a range of other countries legislatures)
So what is going on with the over 70s? Well if I assume a random distribution of ages, following the median member of congress and the standard deviation of the members of congress, I very easily match the %age of congress over 70 chart:

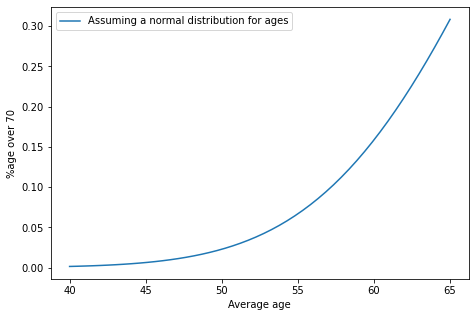
This is what I mentioned at the start. As the centre of the distribution shifts, the amount over a threshold can increase quickly. If I just plot the relationship between average age, and “%age over 70” we can see a fairly non-linear relationship over the range of median age we’ve seen over the last few years: